

Research & Blogs
Observations Using the CoinRoutes Liquidity Metric

Dave Weisberger
November 08, 2023
There has been quite a bit of talk in the crypto markets about thinning liquidity. Much of that chatter has been based upon the decision of a couple of high profile market makers to exit the US market and participants are concerned about the implications of these changes. At CoinRoutes, our software is designed to help investors and traders navigate these difficult markets, but it is equally important to measure what is happening from a market microstructure perspective.
As we discussed in our first quarterly newsletter, CoinRoutes has created a liquidity metric based on book depth data from the major exchanges to measure the cost to trade each covered product. We calculate this measure every second for large cap products by subtracting the cost to trade $25,000 of each product from the cost of trading $1 million of each. The cost assumes optimal smart routing across major exchanges “taking” all available liquidity up to the million dollar threshold. The rationale behind this construction is that, quite often, the “cost” of trading $25,000 is actually negative, IF a trader has sufficient funds and coins on all of the exchanges. After the closure of SigNet and SEN, banking access has become more difficult, and, as we chronicled in our Q1 report, such negative situations have become more common.
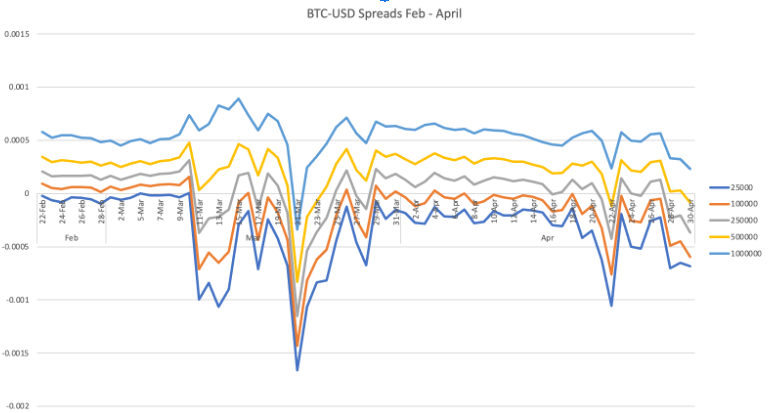
This is readily apparent in the following chart, which shows the cost to trade BTC-USD over a range of sizes:
More important, however, is the impact on overall liquidity, as measured by the CoinRoutes Liquidity Metric. The following chart shows that metric for BTC-USD through the end of April.
One can clearly see that the banking crisis that started with Silvergate shuttering SEN, progressing to the closure of SigNet, significantly impacted the market structure in March. As we noted in our last report, however, the market had started to normalize towards the end of the month. In April, however, the ongoing regulatory challenges resulted in at least two significant market makers pulling out of the US market. This is shown by another clear dip in the chart, signifying exchange price disparities at the top of their order books.
More important, however, is the impact on overall liquidity, as measured by the CoinRoutes Liquidity Metric. The following chart shows that metric for BTC-USD through the end of April.
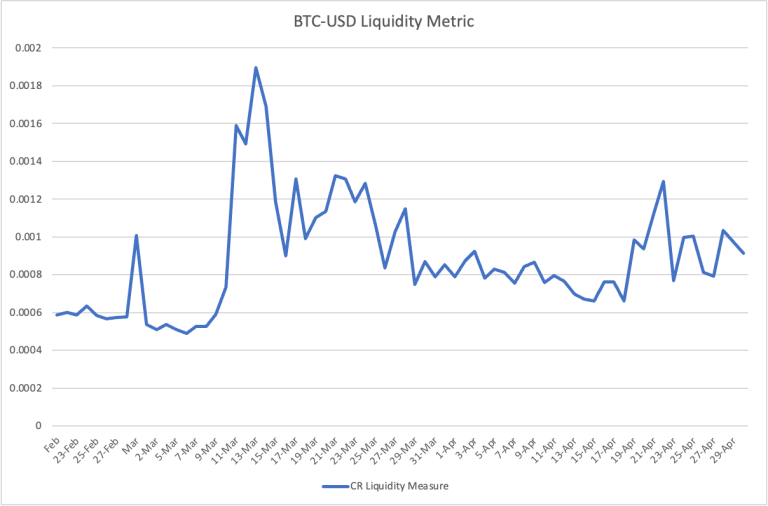
Quite clearly, the SigNet shutdown was an extreme event, with trading costs rising by a factor of 3 times at the peak of the disturbance, but also clearly, the pullout of market makers resulted in a doubling of trading costs for a time. While the market is adjusting to the “new normal”, costs for trading a million dollars of Bitcoin are still 50% above the previous average.
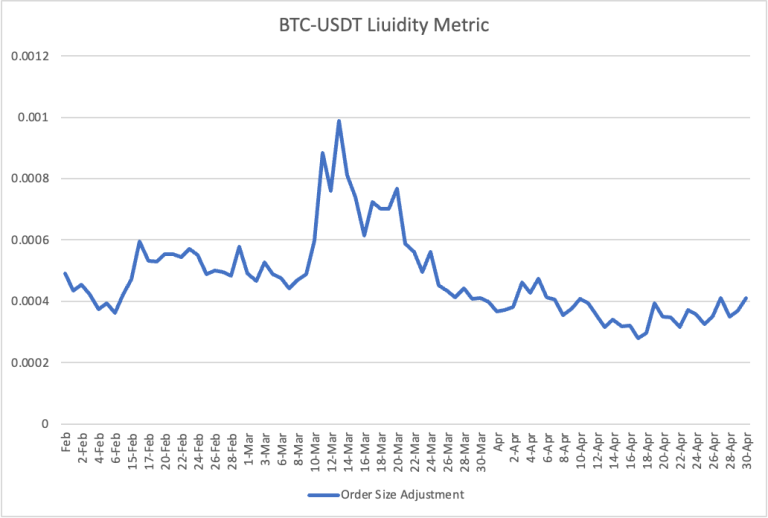
A lot has been discussed about the deleterious impact of US regulatory policy, but, at CoinRoutes, we prefer to quantify such impacts. Using the CoinRoutes liquidity metric allows us to do just that. Compare the BTC-USD chart shown above to the charts of the same metric for Bitcoin traded against USDT and the impact is clear. First look at the full spectrum of sizes for BTC-USDT:
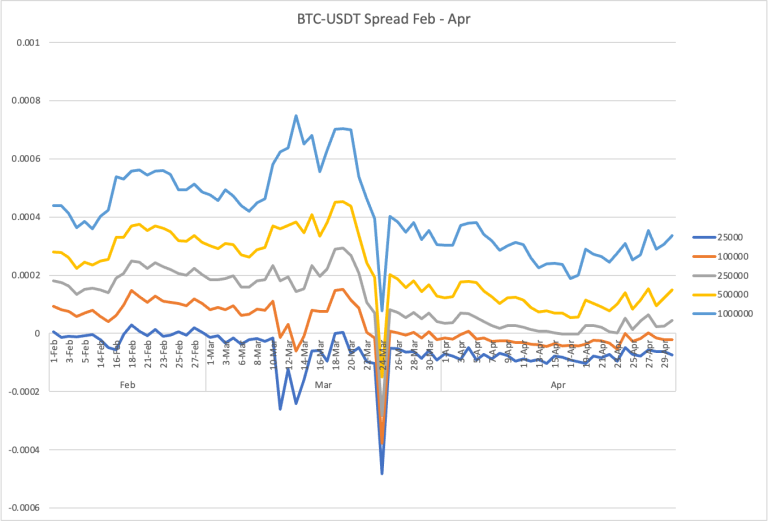
The data shows that there was a substantial move in available liquidity in March, during the worst of the banking crisis, but the markets for USDT traded bitcoin stabilized, reverting to a “normal” state by the end of the month. More importantly, the perturbation in April we showed earlier for BTC-USD did not materialize in the USDT traded pair. More significantly, the trading cost metric shows that BTC vs USDT costs did not spike in April, and are close to historical averages.
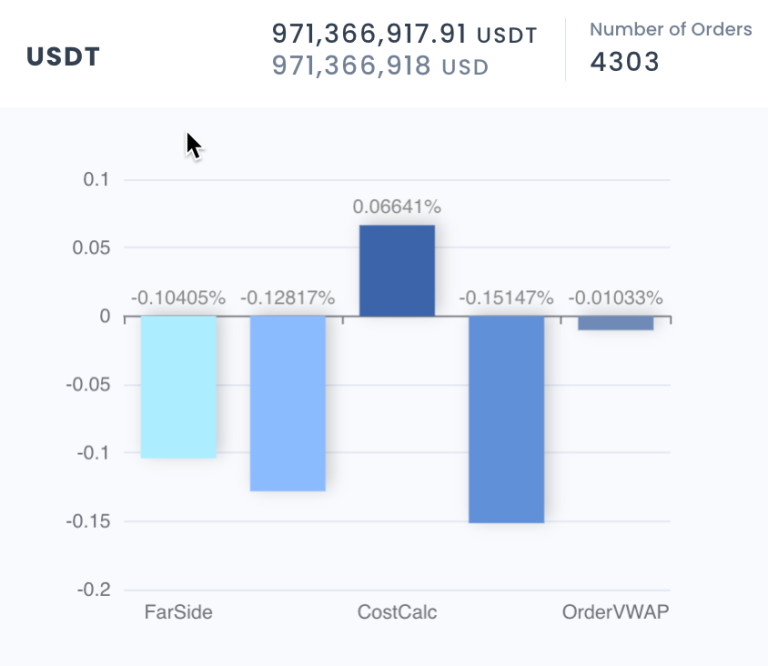
There are two important implications of the data displayed in these charts. First, and most obvious, the U.S. is already losing market dominance in crypto trading. Stablecoin based trading is increasing in importance globally, and, despite the negative press clippings, that market on major exchanges displays a healthy microstructure with substantial liquidity. Second, these market structure changes directly benefit trading firms with access to sophisticated trading software (such as CoinRoutes provides). The ability to harness liquidity from multiple funding sources and exchanges creates superior performance. Consider, for example, this graph showing our clients aggregated performance using our base “smartpost” algorithm on the Bitcoin-USD pair in April.

This analysis shows that, for a sample of 521 orders averaging roughly $1.8 million per order, that CoinRoutes executed, the performance,net of fees, was less than 2.5 basis points from the midpoint, less than 1 basis point from the far side of the quote and a whopping 17 basis points better than optimal smart routing for BTC-USD. At the same time, for spot trades of all products with USDT as the funding currency, for much smaller order size of $225,000, the performance was still good at more than 6.6 basis points better than smart routing, but the benefit of finding better priced liquidity was noticeably smaller.
The simple conclusion, therefore, is, as markets become either more fragmented or less liquid, the more important the use of algorithmic tools becomes to the bottom line of investors.


