Research & Blogs
CoinRoutes Quarterly Market Data Analysis Q1 2023

Dave Weisberger
November 08, 2023
This is the inaugural CoinRoutes Liquidity Analysis newsletter, which attempts to answer a seemingly simple question:
What IS the cost to buy and sell Bitcoin & other crypto assets?
The question sounds simple, but alas, it is not, with the vast majority of the market ignoring other participants & trading at prices which are often higher or lower than the actual market. There are several reasons phenomenon:
A perceived lack of data — as there is no “official” consolidated best bid and offer (BBO) for crypto assets
Market Fragmentation — as there are many marketplaces including centralized exchanges (CEXs), liquidity providers (LPs) and decentralized exchanges (DEXs) with conflicting price oracles.
Opportunism — as many market agents ignore “best execution” responsibilities to their clients in favor of maximizing profits from payment for order flow (PFOF) arrangements and keeping their costs down.
Our goal in this newsletter is to provide DATA to help investors & trading firms understand the details of that fragmentation & identify strategies to overcome it. We will start with a quick recap of the past month of trading and then dive into the data.
March 2023 Recap
As was discussed in our blog post last month, the closure of the SigNet and SEN networks which processed dollar payments between participants immediately had a profound impact on the market microstructure of USDollar based crypto pairs. Immediately after the announcements, the average negative spread between the best bid and best offer jumped dramatically. It fluctuated wildly for most of the month, but steadily started to normalize as the month ended. As can be seen in the following chart, Ether spreads increased more than Bitcoin and the spreads on USDT pairs did not move that much throughout the month. By month end, the spread on Ethereum was still around 50% higher than the previous average, but that is a massive improvement over the 1000% increase seen on the worst day.

It is important to understand the implications of these larger negative spreads. First, it shows how important professional market makers and arbitrageurs are to the market. Most crypto investors trade on a small number of platforms, often relying on a single one. In that case, without the arbitrage mechanism functioning well, investors can often receive inferior prices. Even with arbitrage, however, trading with knowledge of the consolidated market leads to superior performance as we will discuss later in this report.
CoinRoutes RealPrice Statistics
Beginning in February, we began calculating the cost to buy or sell a range of US dollar notional amounts of the top crypto pairs every second of every day. For each pair, we are showing, net of fees, the cost for optimal routing, which would assume coins or funds on every one of the major exchanges for $25,000, $100,000, $250,000, $500,000 and $1 Million.
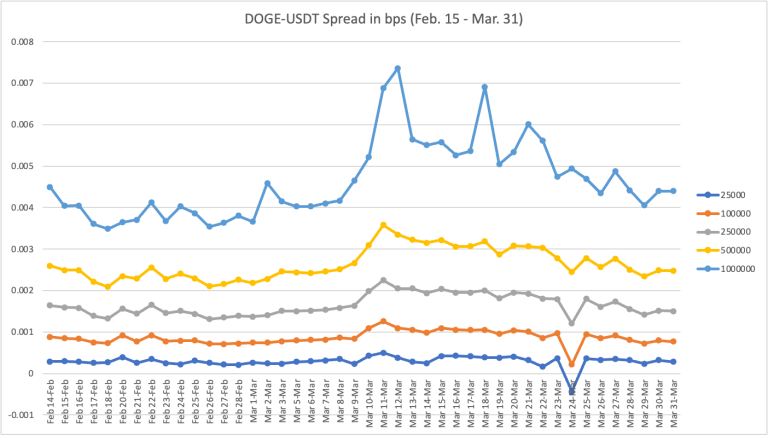
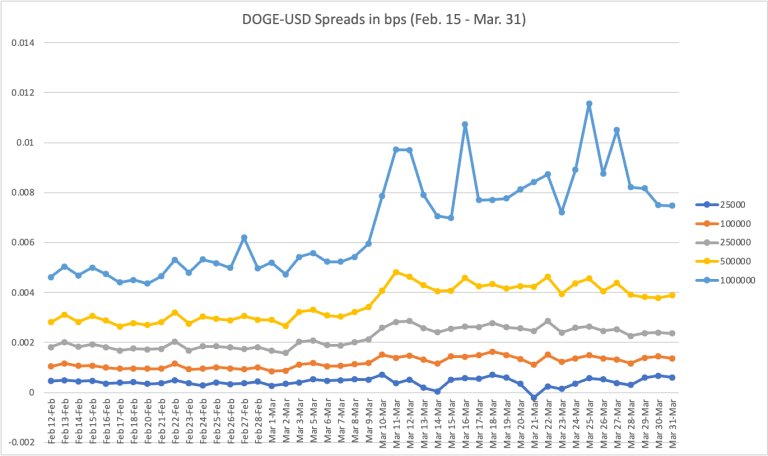
Below are the charts for Bitcoin and Ethereum for that time period for both USD and USDT pairs, which show the impact of the Signet closure. While we see the effects in both USD and USDT, the impacts are much more drastic forthe USD pairs:
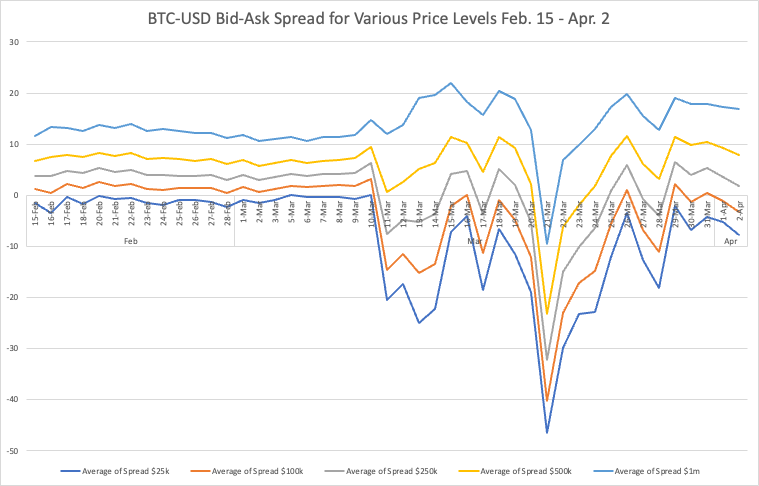
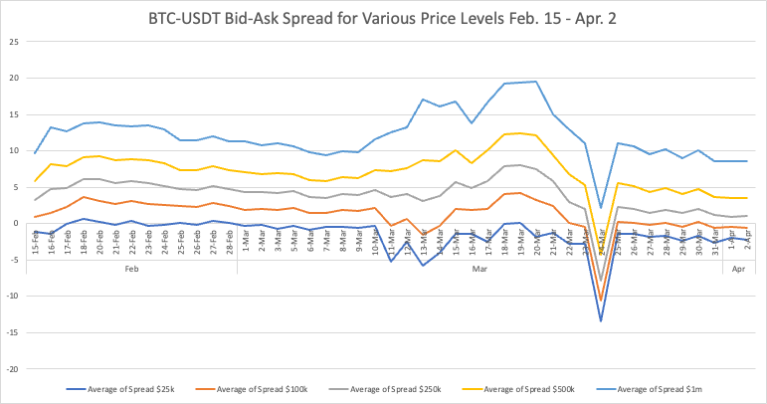
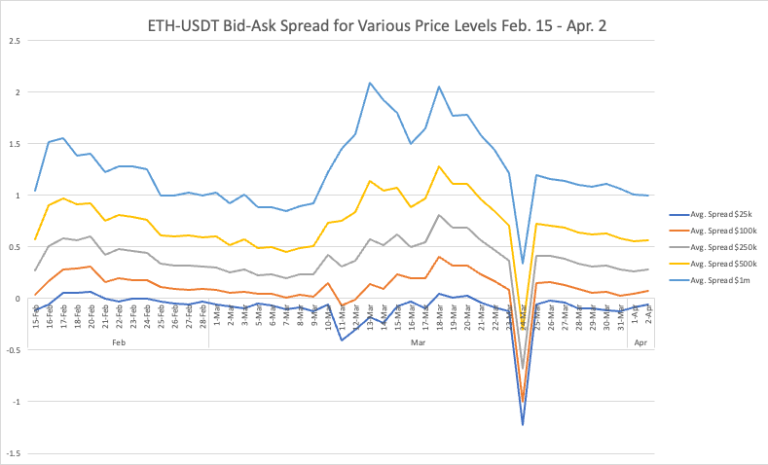
The magnitude of the crossed markets became so extreme at one point, that even $1 million orders were crossed to a small extent for both Ethereum and Bitcoin US Dollar pairs. Considering the cause was an inability to quickly move funds between exchanges, most clients experienced this as an increase in trading costs. Many investors that analyzed their trading costs also noticed a distortion of their “normal” benchmarks, which were distorted by the “starting” point of much larger than normal negative spreads. While CoinRoutes performance statistics were actually better against this benchmark during the volatile period (described below), this distortion prompted us to create a new metric of available liquidity.
The CoinRoutes Liquidity Analysis:
In order to remove the effect of significantly crossed markets, we calculated the difference between a $25,000 order, which can be thought of as a “round lot” for our TradFi readers and a $1 million order, which represents a reasonable threshold for large liquidity demanding trades. That difference is calculated in real time and is illustrative of the liquidity available instantaneously on the order books of the major exchanges.
This chart shows the liquidity cost to execute a $1 million order in Bitcoin and Ethereum over the month, with the starting point of a $25k order subtracted:
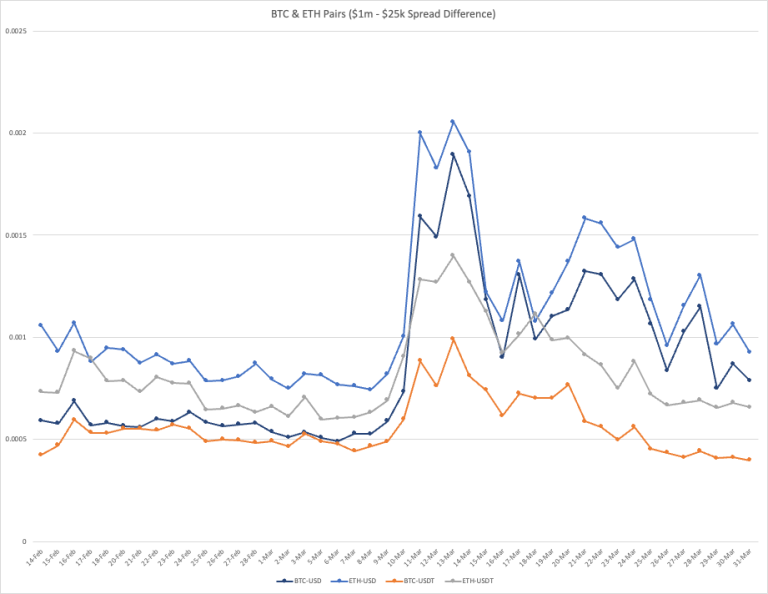
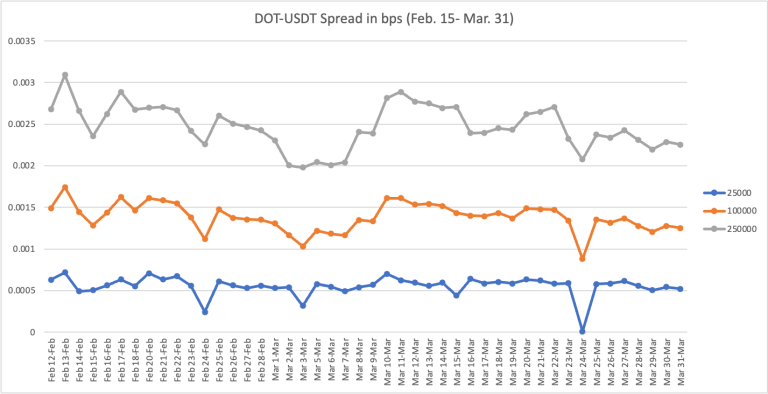
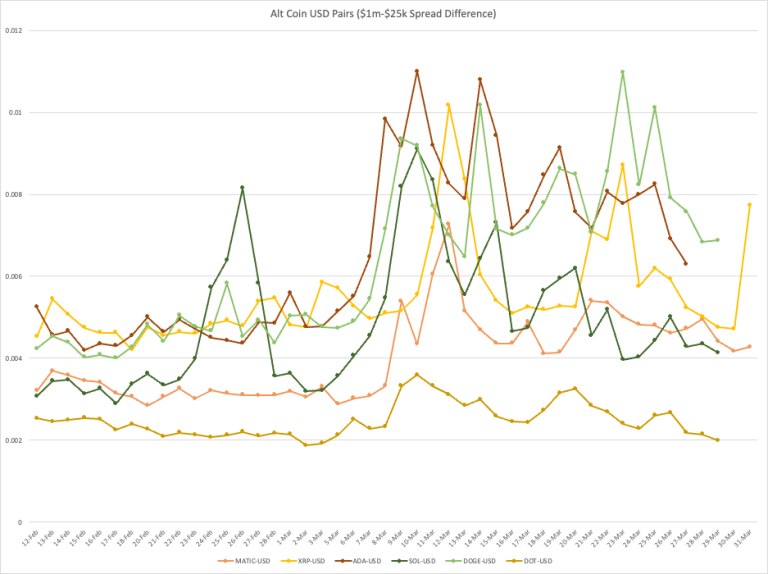
What is important to note, is that, even though the market had substantial negative spreads at the TOP of the order books in the middle of March, at the same time, the DEPTH of the order books decreased, making trading more challenging. We analyzed many other crypto assets and found similar patterns, although less liquid coins like PolkaDOT showed smaller volatility in their liquidity. We theorized that the more liquid assets have a higher percentage of their trading on CEXs, which could account for that effect.
This metric, soon to be available on the CoinRoutes platform in RealTime, can help traders understand available liquidity and how it compares to other time periods. At a minimum, it explains quite well how fragmented the market is and why using a platform such as CoinRoutes to trade is a more optimal choice than solutions which ignore a large percentage of available liquidity.
TCA Analysis:
While we will be sharing separately a more extensive and detailed TCA analysis for Q1 shortly, there are several highly illustrative charts worth including in this newsletter, as they directly relate to the market dislocation chronicled.
First, we show the aggregate TCA statistics for the entirety of Q1 in 2023 of orders greater than 250k using our vanilla smart post algorithm.

For USD products, this analysis shows an average slippage to the Midpoint of the BBO of just under 9 basis points and an outperformance vs optimal routing of just under 13 basis points. For USDT denominated products, the analysis shows slippage vs the midprice of just under 17 basis points and outperformance of optimal routing of roughly 8 basis points. (This is for an average order size of over $1 million per order)
The following chart shows the same analysis for the subset of orders during March 2023 alone. As noted above, this was a significantly more difficult trading environment overall, but the results are much better. For USD products the average slippage vs the midpoint was also under 9 basis points, but compared to optimal routing, the outperformance jumped to over 26 basis points. For USDT products the slippage was under 12 basis points from the midpoint and the outperformance vs optimal routing was almost 9 basis points.

Based on this data, it seems clear that CoinRoutes consolidated market data and proprietary “fair value” calculations enabled our clients to avoid almost all of the issues created by the volatility and market dislocations.
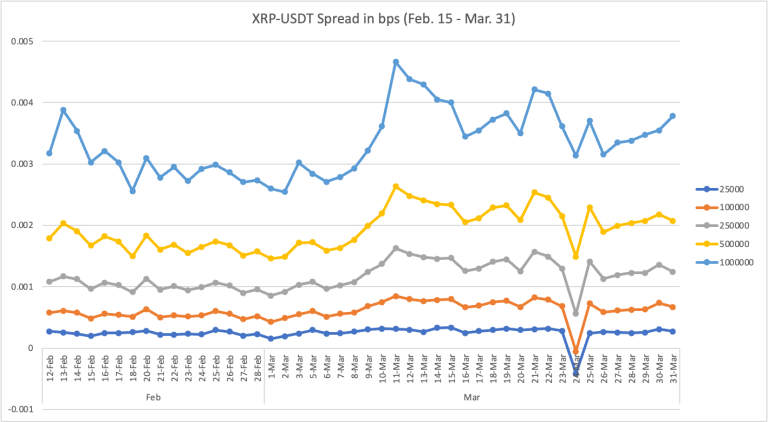
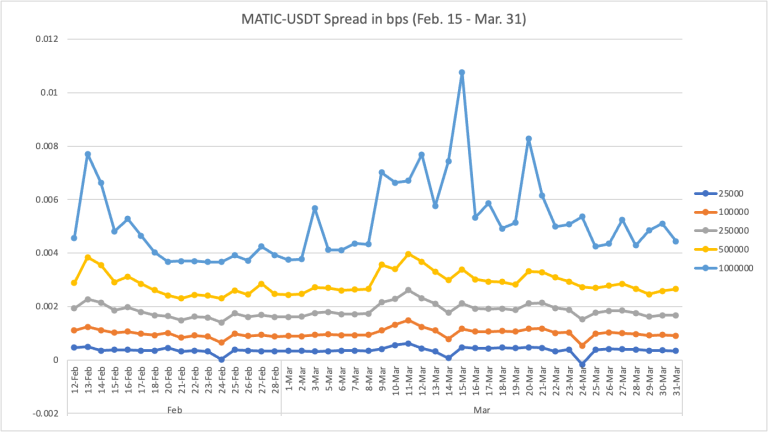
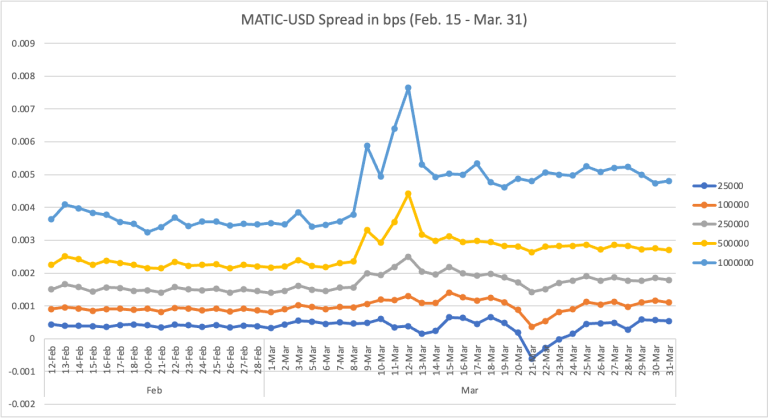
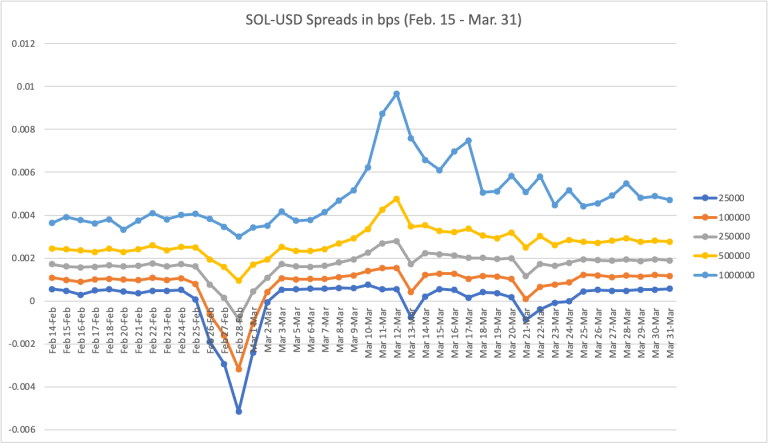
Appendix:
Charts for other top crypto pairs